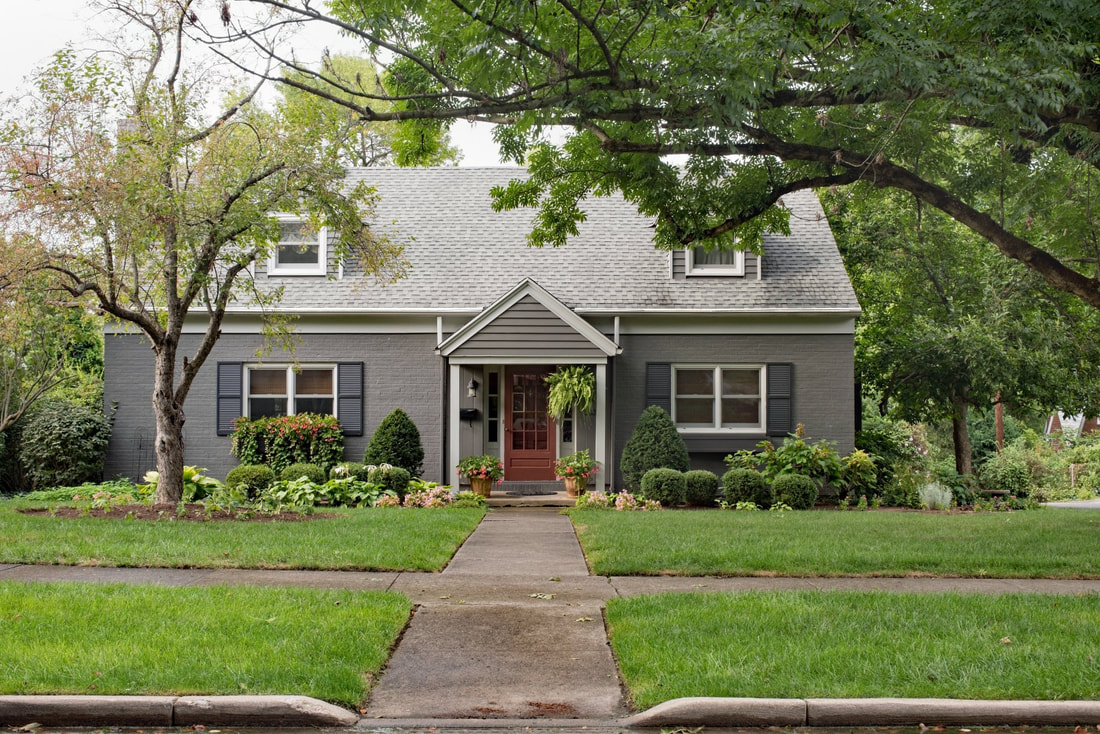
 Move over, fine china — homes just might be the hottest new heirloom.Americans are moving less than ever, according to an analysis of the U.S. Census Bureau’s Current Population Survey. Just 4.2 percent of American homeowners moved between 2015 and 2016 — which is almost half the 7.7 percent rate reported in 1990. According to the Consumer Housing Trends Report 2017, 86 percent of all American homeowners — defined as those who have owned their home for more than a year — have no plans to move in the next three years. Why? Those planning to stay in their homes list love of their home (58 percent) and neighborhood (45 percent) as the top reasons they don’t plan to sell. A smaller, but still sizable, percentage of homeowners list a very generous reason for staying. Almost one-quarter (23 percent), a total of nearly 14 million households, say they’re not moving because they plan to pass down their home to a family member. This is good news for younger generations, who may be struggling to afford to buy their own home or living with their parents while saving up to buy one. In fact, over the past two decades, there’s been a marked increase in the number of young Americans aged 18-34 living with their parents — 33.4 percent in 2016, compared to 27 percent in the late ’70s. This increase isn’t driven by younger generations who may be putting off moving out — it’s driven by older millennials. Since 2012, the percentage of 18- to 25-year-olds living with a parent has actually started to decline, while the share of 26- to 34-year-olds living with parents continues to increase. If their parent(s) are among the households planning to pass their home down, maybe they won’t ever have to fly the coop. Family financial gifts play a big role in helping people buy homes, above and beyond those generous families giving their entire home away. According to the Consumer Housing Trends Report 2017, 14 percent of all home buyers who purchased a home in the past 12 months used a gift from a family member or friend to help pay for the down payment. That number jumps to 20 percent for all millennial (18- to 37-year-old) home buyers.  On Point Homevestments
0 Comments
 See the numbers behind how Americans rent, buy, sell and even think about homeBoth renters and buyers face challenges in finding a place to call home, and the Consumer Housing Trends Report is a deep dive into understanding them. They surveyed over 13,000 people to determine how Americans rent, buy, sell and think about real estate. Below, they break down some of the most surprising results. Renters More Americans are renting today than in recent decades — some by choice and some simply due to market conditions. Thirty-seven percent of American households are renters — about 43.7 million homes — which is an increase of 6.9 million homes since 2005. While part of this increase is due to the 8 million homes lost to foreclosure during the recession, renters today also prize the maintenance-free and flexible lifestyle renting offers.
Buyers Buying is tough in all markets. For most Americans, it’s the biggest purchase they’ll ever make and an investment they’ll tap into as part of retirement. In particular cities, purchasing a home has become a competitive game, complete with bidding wars and offer negotiations. It makes sense that most buyers rely on agents to help them through the process.
Sellers Although some hot markets have favorable conditions for sellers, selling is still rarely an easy process. Sellers have two main goals when they list their homes: sell their home in their preferred time frame and for their desired price. Balancing the two is a delicate dance, and most sellers are also buyers searching for a new home.
Homeowners Owning a home is a lot of work. It’s also a great investment, especially in many of today’s markets where annual appreciation rates are higher than they’ve been in decades.
 On Point Homevestments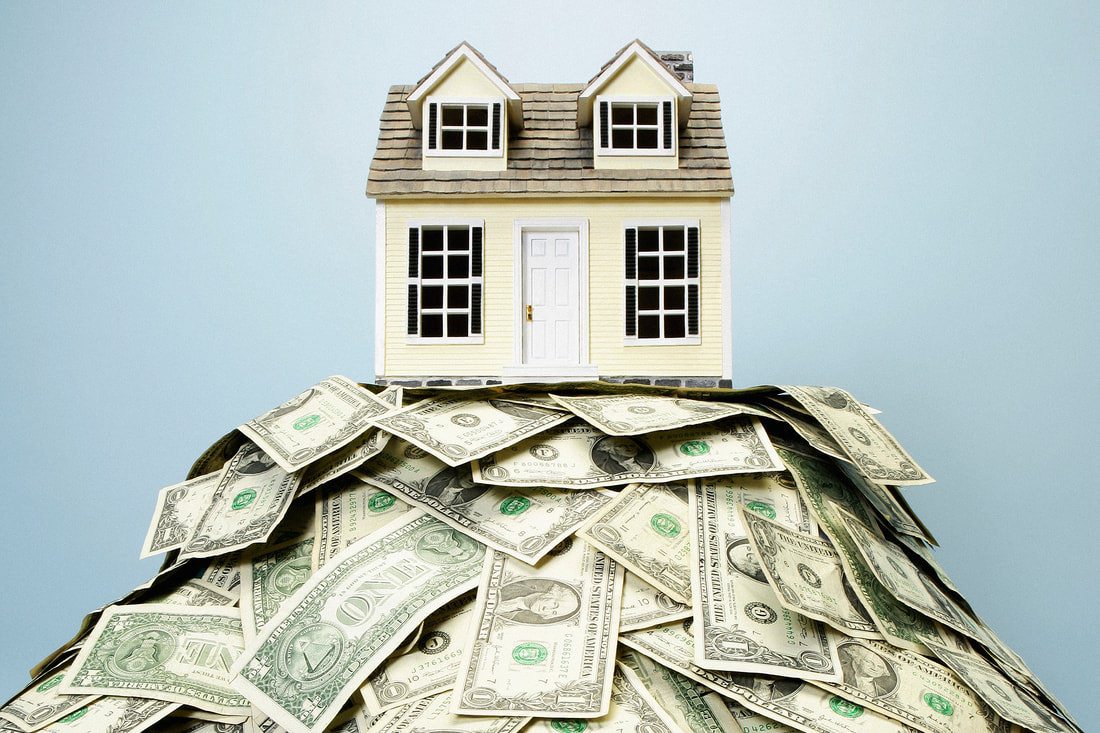 With rents rising and wages stagnant, affording rent can be an insurmountable burdenWhile homelessness may not be viewed as a looming issue for those who are financially stable, it’s not as distant as some might think. With rents rising faster than wages, the burden of affording rent is looming larger and larger for many Americans and, in, some cases becoming insurmountable. According to the Consumer Housing Trends Report 2017, 79 percent of renters who moved in the last 12 months experienced an increase in their monthly rent before moving to a new place. And over half (57 percent) said that hike was a factor in pushing them out the door and into another rental. Only 21 percent of renter households didn’t report experiencing a rent increase. Nearly a third (30 percent) of households nationwide, representing roughly 73 million adults, report they’re struggling or just getting by financially. And it’s no wonder; Americans spend on average a median of 29.1 percent of their income on rent, including many who spend a higher percentage but have lower incomes. Increasingly, major metro areas are becoming out of reach for those who aren’t earning more than minimum wage, and this is becoming increasingly true even in markets that have historically been more affordable. Take Houston, for instance, where the median low-income earner spends 65.1 percent of their income on the median bottom-tier rent. Then there’s notoriously expensive New York, where — along with San Francisco and Los Angeles markets — the median low-income wage will not even cover a low-end apartment. In New York alone, to afford apartments with median bottom-tier rents, renters need to shill out 111.8 percent of the median low-income wage. With such large percentages of household incomes going toward rent, saving for the future is less of a priority — and a possibility. More than half (51 percent) of Americans say they don’t have enough money saved to support themselves for three months, according to a analysis of the Federal Reserve Board’s 2016 Survey of Household Economics and Decision-making. Millions struggle to afford stable housing According to the Report on Consumer Housing Trends 2017, today’s median household income for renters is $37,500, which equates to about $18 per hour — or 2.5 times the federal minimum wage of $7.25. Nationwide, in 2016, 2.2 million people lived off wages at or below the federal minimum wage, according to the U.S. Bureau of Labor Statistics. When it comes to renting, there is no state where a 40-hour minimum wage is enough to afford a 2-bedroom apartment, according to the National Low Income Housing Coalition. While renting is becoming increasingly more difficult, buying a home becomes a distant dream.“Honestly, if you’re making $37,500 per year and have no savings, it’s probably not feasible for you to buy in most markets,” Zillow Chief Economist Dr. Svenja Gudell says. Across all states, the median renter can expect to pay $1,430 per month on rent. It’s no wonder many Americans are struggling financially — particularly in New York, Los Angeles, Washington D.C., and Seattle, where there’s also a stronger relationship between rising rents and an increase in the homeless population. Homelessness by the numbers Coast to coast, there are an estimated 550,000 homeless people, according to the U.S. Department of Housing and Urban Development. But research used statistical modeling to estimate the uncounted homeless population, unsheltered homeless people often missed during the One Night Counts, to estimate the true number of homeless people, a number much higher than the official estimates. And as rents climb, the numbers will only grow, especially in large, tight metros, where the rent burden can become life-altering. Take New York City, for example. The metro has the largest population of homeless people in the nation. Last year, there were an estimated 76,411 people experiencing homelessness, according to estimates. If rents were to rise 5 percent, an additional 2,982 people would be forced to the streets. And Los Angeles doesn’t fare much better. Given the same rent hike, an additional 1,993 people would fall into homelessness. And a rent hike of 5 percent isn’t implausible, especially given that in L.A., rents rose 4.4 percent over the past year. The geography of social mobility Right now in L.A., renters dish out $2,707 per month for the median rent, which is almost twice the national median rent and amounts to nearly half of the median household income in the metro. With such a substantial chunk of money spent every month on rent, it’s no surprise the metro has an estimated 59,508 people without a home. But rents haven’t always been so unaffordable. Just 17 years ago, three of the top 20 metros were rent-burdened, meaning renters paid more than 30 percent of their income on living expenses. Today, however, the number of cities that have become unaffordable have grown exponentially. Currently, renters in nine of the same top 20 metros can expect to spend 30 percent or more of their income on rent. The biggest share spent on rent comes from Los Angeles, where renters pay nearly half (49 percent) of their income on rent. “The places where social mobility — the ability to climb the income ladder — is the greatest are now in places that are unaffordable for most people,” said Gudell. “San Jose or the Bay Area in general, parts of Boston, for example — these places have gotten to be so expensive that a lot of people who have an income of $37,500 a year will not be able to buy a home or even afford a family-sized rental.” The costs of housing instability go beyond financial Unfortunately, for too many, lack of affordable housing can complicate other critical aspects of life, including health and future livelihoods. Individuals living in shelters are more than twice as likely to have a disability compared to the general population. This includes serious mental illnesses, conditions related to chronic substance abuse, diabetes, heart disease and HIV/AIDS, according to the U.S. Department of Housing and Urban Development. Gudell says people have better outcomes when they aren’t constantly moving from place to place. “It’s been shown that you have better outcomes if you live in a stable environment with less frequent moves, which is easier to attain when you own versus rent,” Gudell said. “So, if you take stable environments away from people, their outcomes will most likely be worse than they are today, and that has an impact on education, on health and on income growth in the future.”  On Point Homevestments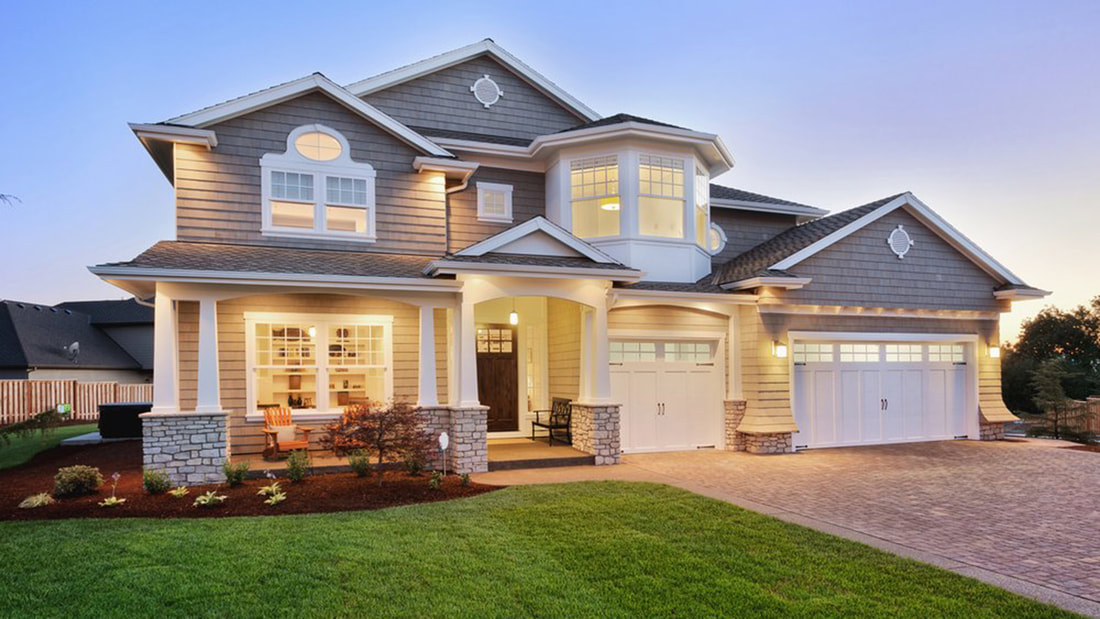 Does your home offer any of the perks some buyers will pay more for?To understand how much your home is worth, you have to know what affects its value. The appraisal of a home value is an estimate tool for extrapolating the real market value of your home, based on existing home-related data and actual sales prices in your area. Thousands of data points correlate with home values and sale prices — some of which are obvious (like the condition of the home) and some that aren’t. Here are several surprising things that can affect either the existing value of your home or the price someone is willing to pay for it, all based on data. 1. Proximity to a Starbucks How far do you have to drive to get a Frappuccino? If the answer is “not that far,” you’re in luck. A 2015 Zillow report found that, between 1997 and 2014, homes within a quarter-mile of a Starbucks increased in value by 96 percent, on average, compared to 65 percent for all U.S. homes, based on a comparison of Zillow Home Value Indexdata with a database of Starbucks locations. To evaluate if this effect is isolated to Starbucks, the research team looked at another coffee hot spot (one with particular pull on the East Coast): Dunkin’ Donuts. The data showed that homes near Dunkin’ Donuts locations appreciated 80 percent, on average, during the same 17-year period — not quite as high as homes near a Starbucks, but still significantly above the 65 percent increase in value for all U.S. homes. 2. Blue kitchens and blue bathrooms Beyond America’s obsession with curb appeal, what’s inside your house counts a lot too — especially the colors you paint the rooms (particularly the kitchen). According to Zillow’s 2017 Paint Color Analysis, which examined more than 32,000 photos from sold homes around the country, homes with blue kitchens sold for a $1,809 premium, compared to similar homes with white kitchens. Blue is also a popular bathroom shade. The same analysis found that homes with pale blue to soft periwinkle-blue bathrooms sold for $5,440 more. Walls painted in cool neutrals, like blue or gray, can signal that the home is well cared for or has other desirable features. 3. Trendy features Joanna Gaines’ aesthetic is permeating more than just your YouTube search history. Zillow listings mentioning the shiplap queen’s favorite features — like barn doors and farmhouse sinks — sell faster and for a premium, according to a 2016 Zillow analysis of descriptions of more than 2 million homes sold nationwide. Listings with “barn door” in the description sold for 13.4 percent more than expected — and 57 days faster than comparable homes without the keyword. Meanwhile, listings touting “farmhouse sink” led to a nearly 8 percent sales premium. Sellers can use the listing descriptions to highlight trendy details and features that might not be noticeable in the photos. 4. How close you are to a city If you own a home in a major American metropolitan area, you’re most likely sitting on a significant (and rapidly appreciating) financial asset. Case in point: Home values in the New York, NY, metro area are worth $2.6 trillion, per a recent Zillow analysis. The average urban home is now worth 35 percent more than the average suburban home. Since 2012, the median home value in urban areas has increased by 54 percent, while the median home value in suburban areas is up just 38 percent.  On Point Homevestments |
Archives
February 2019
Categories
All
|
 RSS Feed
Company |
Services |
|
Possibilities